Chromosonia
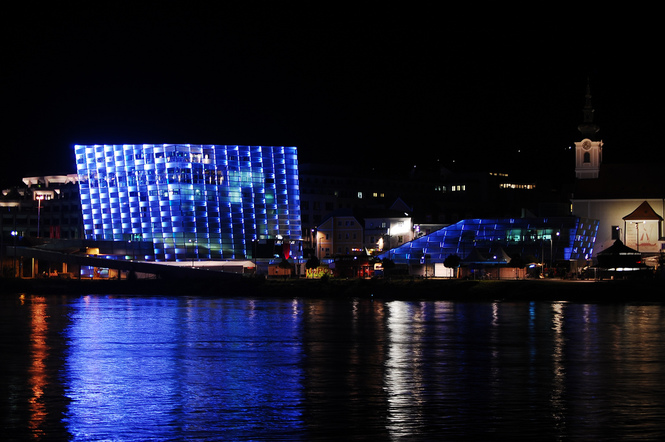
Chromosonia is a social music visualizer installation for the Ars Electronica Center facade, which provides three means for passers-by with a portable music player to visualize their music: perceptual, informational and social.
When a passer-by connects her music player to the system, our software perceptually analyzes the contents of the acoustic signal in real-time. The core part of the perceptual visualization is the Sonotopy library developed by Alex Berman, which is based on a psycho-acoustic model of the human hearing system and neural networks. Sonotopy makes it possible to interpret the music as spatially distributed forms resulting in a novel way of sonic visualization. The adaptive and highly dynamic nature of its algorithm makes it possible for certain musical features to light up specific parts of the building. This dynamic visual pattern organically reflects rhythmic and harmonic changes in the music.
In addition to this perceptual mapping, there are also informational and social layers in the visualization scheme. The informational layer conveys features extracted by matching the audio signal with a database, using music recognition technology. From the detected artist name and track title the system determines the music genre and assigns a color to the perceptual visualization.
For music identification we tried to use the Echoprint open source music id system powered by the Echo Nest. After fiddling with it for about a week we found that it was not mature enough for our purpose. It was just released in June, and as it is a promising system, we may include in later versions, when their database grows and the identification becomes more robust. This time we resorted to a Shazam hack, which was implemented with the help of android developer Andras Turi. A script was written that runs Shazam and takes a screenshot of the result after a couple of seconds. The snapshot was recognized with the Tesseract open source OCR system. The identification data was sent to last.fm for detecting the genre. Using last.fm tags we created a weighted genre fingerprint of the track. A simplified style classification was used with 23 main audio genres. According to the weights and the colors assigned to the main genres the color of the track is found.
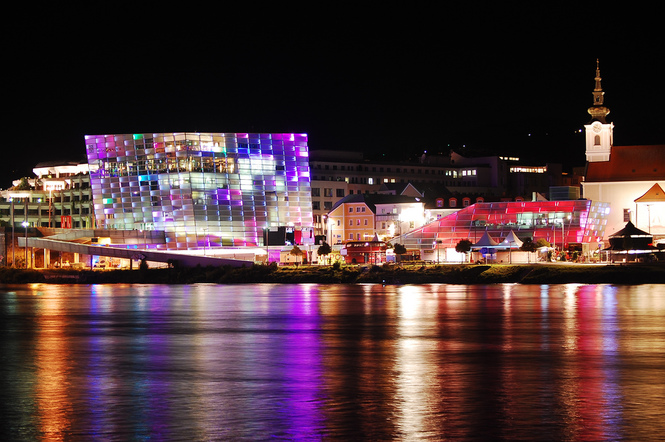
When the music plugged into the facade is stopped, the social visualization enters the frame. In response to an audio device being unplugged, the perceptual and informational visualization occupying the whole building fades and shrinks to one window pulsating to the recorded rhythm of the music. This pulsation still bears the color coded information. After a few seconds all previously visualized tracks fade in on their own window, each pulsating in their own rhythm, using their own genre color. The nodes are organized on the facade according to style, so that certain genres occupy certain areas of the building. The pattern of this topographical organization of all encountered music conveys the musical taste of the visitors.
Credits
Alex Berman, Eszter Bircsák, Zoltán Csík-Kovács, Gáspár Hajdu, Gábor Papp, András Turi
with support from Kitchen Budapest and Ars Electronica FutureLab
Source
under GPLv3
https://github.com/gaborpapp/Chromosonia
